This guide explains how to view and use the manager's dashboard reports for attendance insights. The manager's dashboard provides comprehensive analytics and reporting tools to help supervisors monitor team attendance, identify trends, and make data-driven decisions.
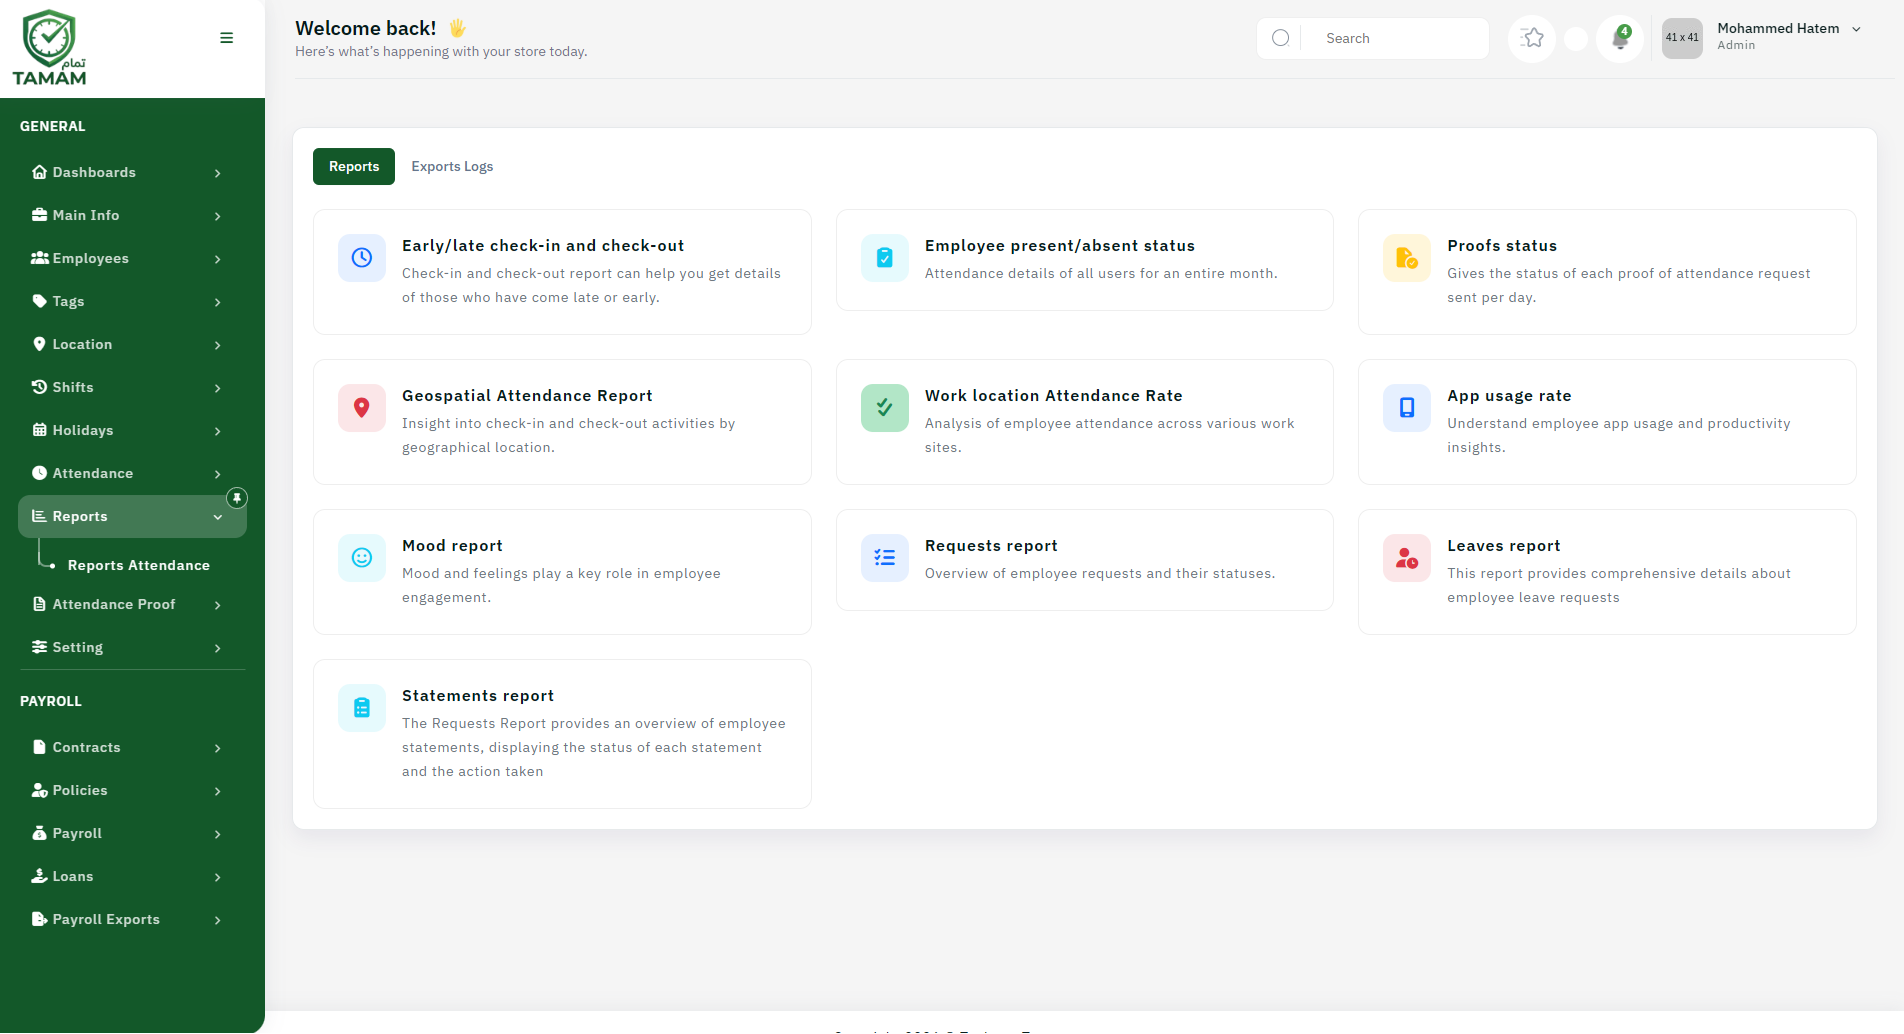
Step 1: Accessing the Dashboard
Log in to your Tamam admin account using your credentials. Once logged in, navigate to the main dashboard area. You should see various widgets and charts displaying attendance data at a glance.
Step 2: Viewing Reports
Select the manager's report from the reports menu. This report typically includes metrics such as total working hours, attendance rates, late arrivals, early departures, and leave utilization. Use the date picker to select specific time periods for analysis.
Step 3: Filtering Data
Use the available filters to narrow down the data. You can filter by department, team, individual employees, or specific locations. This helps you focus on particular groups or areas of interest.
Step 4: Exporting Reports
Once you've customized your view, you can export the report in various formats including PDF, Excel, or CSV. This allows you to share the information with stakeholders or keep records for compliance purposes.Once you've customized your view, you can export the report in various formats including PDF, Excel, or CSV. This allows you to share the information with stakeholders or keep records for compliance purposes.
Step 5: Setting Up Alerts
Configure automated alerts for key metrics. For example, set up notifications when attendance rates drop below a certain threshold or when unusual patterns are detected.
Tips: Regularly review the manager's dashboard to identify attendance trends and address issues proactively. Use the insights to improve team productivity and work-life balance.